Top takeaways:
- Spring and Winter months are projected to have the largest increases in precipitation, meaning more rain and snow, both of which have important implications for transportation and flooding.
- Precipitation projections inherently have a high degree of variability, which can make them difficult to rely on for decision making. However, businesses should consider their risks to both high and low precipitation and take the appropriate actions to address them. Natural infrastructure (e.g., rain gardens, tree planting) can provide resiliency benefits during both drier and wetter years.
- Climate models suggest that increases in precipitation will not be evenly distributed across the GTA. Local features such as bodies of water and paved surfaces may further compound risks of flooding. Businesses should review the data or speak with experts about where their facility is located to better understand their risks.
This Primer uses the moderate (RCP4.5) and high (RCP8.5) emission scenarios as a basis for discussion.
Annual Total Precipitation Trends
TRCA precipitation projections show a wide range of variability and uncertainty in future precipitation patterns. Average annual total precipitation levels are projected to increase across the Toronto region over this century under the high emissions scenario (RCP8.5), while the moderate emissions scenario (RCP4.5) indicates a slight decrease. Due to fewer model runs, the moderate scenario results should be considered with greater uncertainty and may be a factor in the apparent decreasing trend. Other climate change impact assessments project an increasing trend in annual total precipitation over this century under both moderate and high emissions scenarios [1], [2], [3].
Warmer air holds more moisture to produce storms. Not only is the total amount of precipitation expected to increase, but the intensity and unpredictability of precipitation events are also projected to increase over this century [4]. While annual total averages show an increasing trend under the high emissions scenario, the spatial and temporal distribution of these trends show a high degree of variability. This means that more precipitation will fall in some areas over a certain period, while other regions may see decreases.

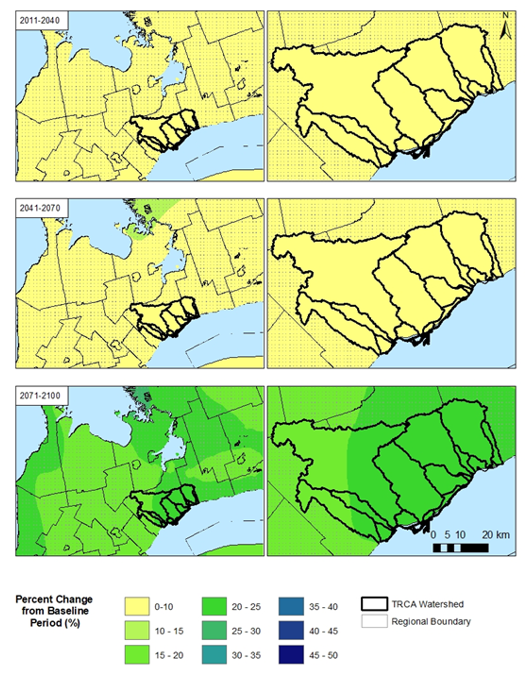
Under the high emissions scenario, annual precipitation is expected to increase above 1971-2000 historical levels by:
- 36 mm/year in the 2020s
- 109.6 mm/year by the 2050s
- 182.6 mm/year by the 2080sxiv
This represents a 15-25% change in precipitation by 2100, with greater precipitation expected in the eastern parts of the Toronto region (Figure 1).
For context, in the City of Toronto, the month of August typically sees the highest precipitation over the year, with an average of 81.1 mm/year of precipitation over the 1981-2010 period [2]. High emissions scenario projections suggest that climate change could bring precipitation equivalent to an additional two months of August-like precipitation every year by the end of the century.
Seasonal Precipitation Trends
Though annual total precipitation trends can be informative, understanding seasonal total distributions can provide a better indication of potential impacts as the amount of precipitation that falls will vary by season.
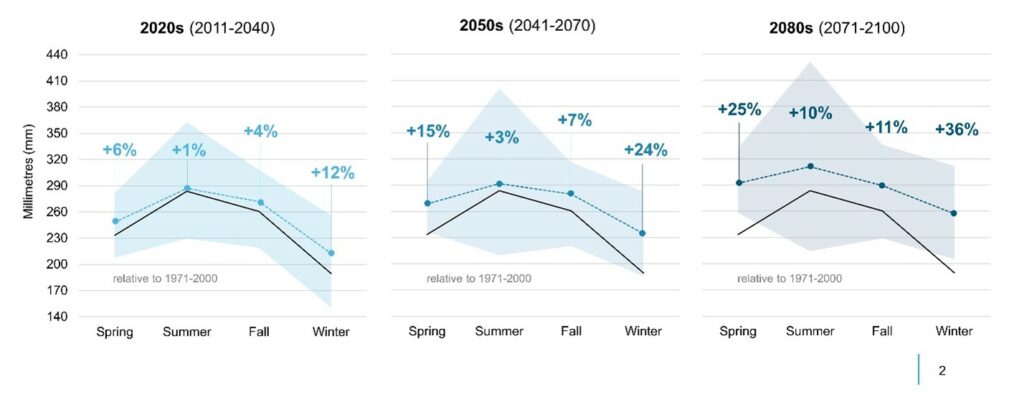
TRCA projections under the moderate emissions scenario show a decrease in precipitation in the spring, summer, and fall seasons, with the largest decrease evident in the summer. Meanwhile, high emissions scenario projections indicate an increase in average total precipitation across all seasons, with winter and spring seasons seeing the largest increases in precipitation of 36% and 25% by the 2080s, respectively [5].
Both moderate and high emissions scenarios project an increase in winter precipitation by 14-33%, respectively [5]. Another important feature of this figure is the variation inherent in precipitation projections. The variability is highest over the summer season indicating that some climate models are projecting wetter summers, while others are projecting drier summers. The ensemble average of all model projections is indicated by the dotted line, providing a reasonable projection of future total precipitation and accounts for some of the uncertainty.

Bottom Line
Modelling precipitation patterns is complex and has a wide range of variability and uncertainty. Identifying where climate change projections are in more agreement on future precipitation patterns can help businesses identify potential impacts. TRCA projections suggest that greater precipitation can be expected during the winter season. Under a high emissions scenario, summer precipitation shows a wide range of uncertainty over this century, suggesting that some summers will bring greater than historical average precipitation, while others will see drier summer conditions.
Increasing annual and seasonal total precipitation can overwhelm ecosystems and infrastructure, resulting in damage and disruption through flooding. Prolonged dry periods may also cause further stress to humans, wildlife, and crops when coupled with increasing temperatures. The increasing temperatures and precipitation will bring higher occurrence and severity of extreme weather events to the GTA. As precipitation patterns across TRCA continue to change, natural and human systems will be impacted. TRCA’s Climate Summary Tables provide an overview of several extreme climate parameters over the 21st century and their corresponding trend.
Partners in Project Green’s Building a Climate Resilient Business Resource Kit provides a foundation in the basics of current climate science, the impacts of climate change on businesses, and mitigation and adaptation strategies. Please explore these resources and connect with us to advance your organization’s climate resiliency.
To learn about the impacts of climate change on business, check out:
[1] Bates, S. & Carlowicz, M. 2021. 2021 Continued Earth’s Warming Trend. Nasa Earth Observatory. URL: 2021 Continued Earth’s Warming Trend (nasa.gov).
[2] Zhang, X., Flato, G., Kirchmeier-Young, M., Vincent, L., Wan, H., Wang, X., Rong, R., Fyfe, J., Li, G., Kharin, V.V. (2019): Changes in Temperature and Precipitation Across Canada; Chapter 4 in Bush, E. and Lemmen, D.S. (Eds.) Canada’s Changing Climate Report. Government of Canada, Ottawa, Ontario, pp 112-193.
[3] IPCC, 2021: Climate Change 2021: The Physical Science Basis. Contribution of Working Group I to the Sixth Assessment Report of the Intergovernmental Panel on Climate Change[Masson-Delmotte, V., P. Zhai, A. Pirani, S.L. Connors, C. Péan, S. Berger, N. Caud, Y. Chen, L. Goldfarb, M.I. Gomis, M. Huang, K. Leitzell, E. Lonnoy, J.B.R. Matthews, T.K. Maycock, T. Waterfield, O. Yelekçi, R. Yu, and B. Zhou (eds.)]. Cambridge University Press, Cambridge, United Kingdom and New York, NY, USA, In press, doi:10.1017/9781009157896.
[4] Hausfather, Z. 2018. Explainer: What climate models tell us about future rainfall. Carbon Brief. Accessed August 31, 2022. URL: https://www.carbonbrief.org/explainer-what-climate-models-tell-us-about-future-rainfall/
[5] Toronto and Region Conservation Authority (TRCA), 2021. TRCA Climate Change Projections under RCP8.5 and RCP4.5 (1971-2100) (Version 1). TRCA Open Data. https://data.trca.ca/dataset/trca-climate-change-projections

